Tools to Enhance Your Web Development and Debugging Experience on Safari
Introduction
Safari is a browser that belongs to Apple's ecosystem. It was introduced in 2003, and since then, it has become a go-to browser for many people. Safari was not just hailed for it its speed, efficiency, and integration capabilities but also for its in-built developer tools. These tools contribute greatly to the web development process. The user-friendly interface facilitates a streamlined and robust web development experience. In this blog post, we will try to understand the web development and debugging process along with the in-built developer tools available on the Safari browser. We have also included some of the third-party extensions supported by Safari browser that abets to create, design, and optimize websites on the Safari browser.
Web Development and Debugging
Web development is the process of building, creating, and maintaining websites. Web designing, programming, server configuration, and DBM are all a part of Web development. There are two major categories here, front-end and back-end. Front-end is the client-side development, while the back-end is for the server side. Both put together is known as full stack development. HTML, CSS, and JavaScript are the main front-end technologies, while PHP, Ruby, and Python, among others, are the technologies that facilitate back-end development.
The flip side of creating something, in order to ensure seamless working, is identifying and eradicating errors. In technical terms, this is referred to as debugging. So, the process of detecting and correcting bugs, aka errors in a computer program, is called debugging.

The predominantly found errors are syntax, runtime, logical, and semantic errors. One requires excellent coding knowledge and command over the tools of an Integrated Development Environment to inspect a program, understand the breakpoints and debug them perfectly.
Safari Developer Tools – An Overview
Before we dive deep into the detailed aspects of Safari's developer tools, let us take a quick tour and understand the key points.
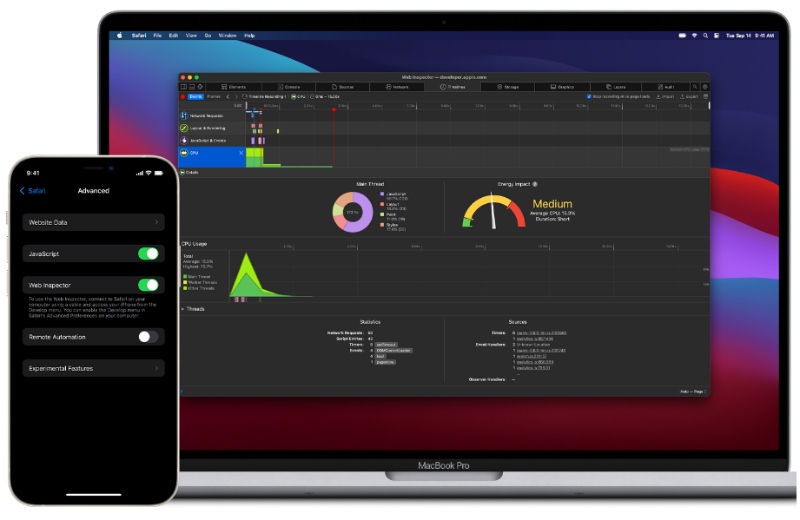
Safari's developer tools are collectively referred to as the Safari Web Inspector. Safari Web Inspector is a set of powerful tools designed to help a developer create, maintain, debug, and optimize a website. Since they are built-in tools, they are easily accessible and convenient to use. The prime features include the inspection of HTML elements. CSS Styles. JavaScript, network, and performance monitoring.
Developer tools are often understood as tools that are toyed around for mere exploration and creativity purposes. However, developer tools are certainly more than that, as they play an integral role in the web development process. Apart from the other predominant features, Safari Web Inspector has a feature called the 'Network Tab' that helps identify problematic network requests sent to the site. Identifying and eradicating such sources is key to improving the loading performance of a website. Likewise, the Performance and Memory tabs also help optimize a site's speed and efficiency. This clearly indicates that Safari Web Inspector is a comprehensive suite that provides insights and controls needed to shape a user-friendly and better responsive site. Another significant aspect of the Safari browser is its ability to access third-party extensions supporting the web development process. This way, Safari has found its way to become Apple users' favorite browser of all time.
Now let us analyze the features one by one.
Safari Web Inspector - Decoded
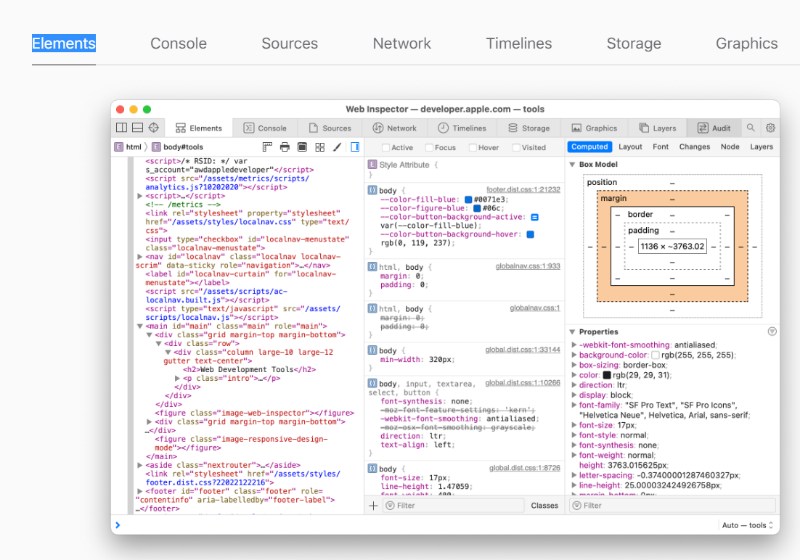
The Web Inspector is Safari's built-in suite offers a range of features, including:
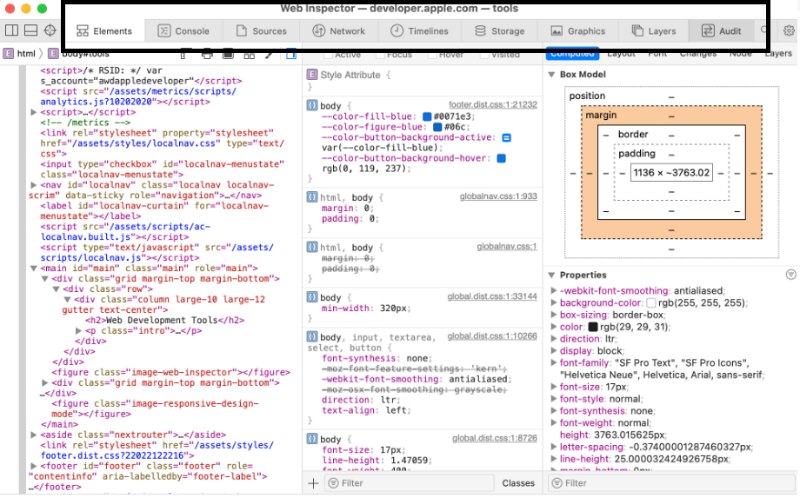
Inspect Element
Web developers sweat out to create a user-friendly and interactive site that is easy to navigate and, at the same time, doesn't bore the user. Users who don't know what goes behind this web experience marvel at what the internet does on their mobile/computer screens. A site that is slow to respond kills its viewership drastically.
That is why web developers are keen on the inspect element. This element enables the developer to pick a specific element and view its corresponding HTML and CSS. These elements together make up the site, and understating them strand by strand helps the developer understand the structure of a website at its root level. Inspect element also plays its role in eliminating the bugs. For instance, as we already know, inspect element feature displays the HTML and CSS of a specific element. Perhaps a certain CSS style could be overriding another, or maybe there is a typo in the HTML code. The issue can be quickly identified and resolved by viewing the code this way and using the real-time editing facility.
The Network Tab
We have already seen a line or two in the overview about the role of the Network Tab in the developer's kit. Let us understand the features and functionalities of the network tab more elaborately.
A developer should understand trashy network requests made by the site. To help the developer, the network tab makes a log entry of all the network activities related to the webpage and the request the page makes. This includes requests such as response headers, status codes, and timelines.
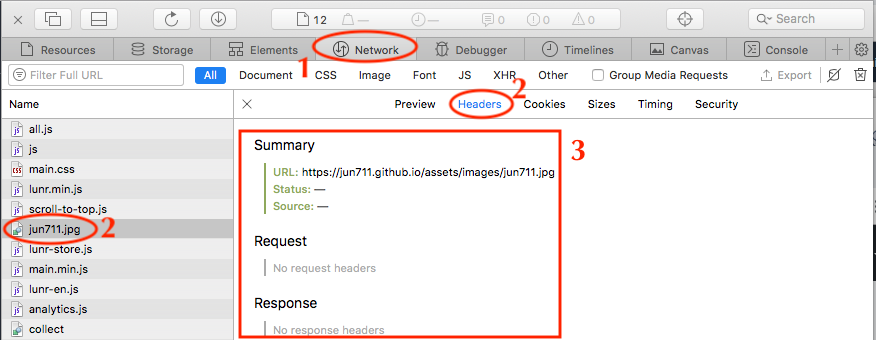
To access the Network Tab, open the web inspector by right-clicking on the webpage, selecting the 'inspect element' – then choosing the network tab that appears at the top of the Web Inspector Window.
This tab provides a list of the network requests the page has made in chronological order. The list usually comprises HTML files, AJAX requests, CSS stylesheets, JS files, images, etc. The 'time column is convenient for checking the time length of each request and thus makes it easy to identify the requests slowing down the web page. Let us take an example of an image that takes too long to load. That is probably because it is too large or simply doesn't belong to the site-friendly file types. Understanding this will help the developer to optimize the image accordingly.
The network tab also helps in checking the request and response details which is very valuable for debugging the site. Requests go to the wrong URL, and fetching data from an API may not work. The network tab allows you to spot and diagnose these issues and resolve them without much difficulty.
Debugging JavaScript – Debugger tool
Whether you are working with a complex framework or a simple one, a debugger tool can come in quite handy. The debugger tool is specifically designed for debugging JavaScript. The debugger tool has three key features: adding breakpoints, stepping through code, and watching variables. Going through an executed program, specifically to spot errors, could be painstaking. This is where the Debugger tool's 'adding break points' truly feels like a Godsend feature. By simply clicking the margin next to the code, you can pause the code execution and inspect the existing status of your code.
As a continuation to the previous step/feature, the 'Stepping through Code' feature helps to see how your code gets executed 'LINE BY LINE.' Using this feature, a developer can skip to the next line, step into and step out of its function, that is, go into the details of a function and come back to the current function without losing trajectory.
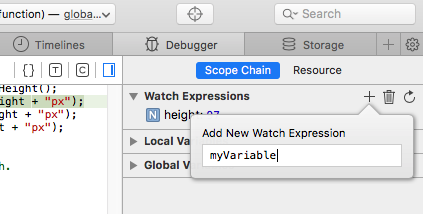
Will it not be great to keep track of how a variable changes as a code executes? A user may know nothing of its significance, but certainly, a developer will. The debugger tool's feature lets the developer create a watchlist and add variables to it. The debugger will then display the current value whenever the code execution pauses. The entire process of debugging JavaScript becomes more efficient and less stressful using the debugger tool.
Console
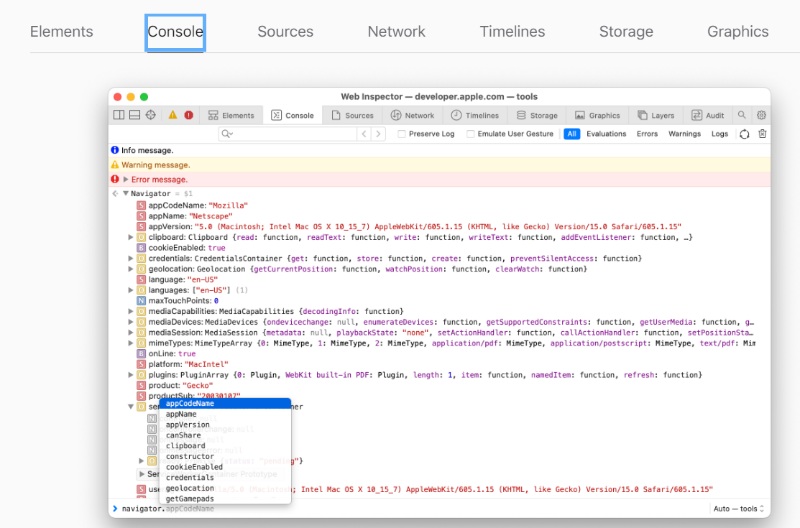
Among the other important features of the Web Inspector, the console cannot be missed out. The console displays the JavaScript errors that occur as you browse and creates a log of what has happened and where it happened too. This, again, is a feature that is quite specific to the JavaScript code. It primarily experiments with the JavaScript functions, testing out snippets and fixing the bugs, and also manipulating the webpage on the page. You can also use console-specific commands, such as console.log(), console.warn(), or console.error(), to output information to the console from your code.
Storage and Cookies Management
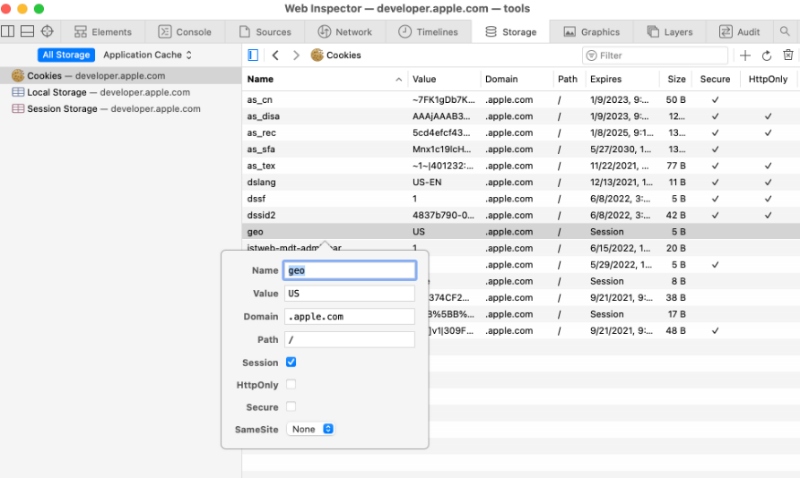
The ability of storage tab in Safari's Web Inspector can be an invaluable resource for manipulating storage types and learning how a website uses client-side storage. This feature entails the ability to debug such data storage in the event of any errors related to the same. There are a plethora of storage mechanisms, such as Local Storage, Session Storage, indexed DB, Web SQL, and Cookies. These can be efficiently managed with the help of the 'Storage Tab.'
Cookie-related details such as name, value, domain path, and expiry date can be managed here. It also ensures that the cookies created by the webpage or website are secure and HTTPOnly. For the purposes of testing and debugging, cookies can always be modified and deleted, while new ones can also be created.
Audit Tool
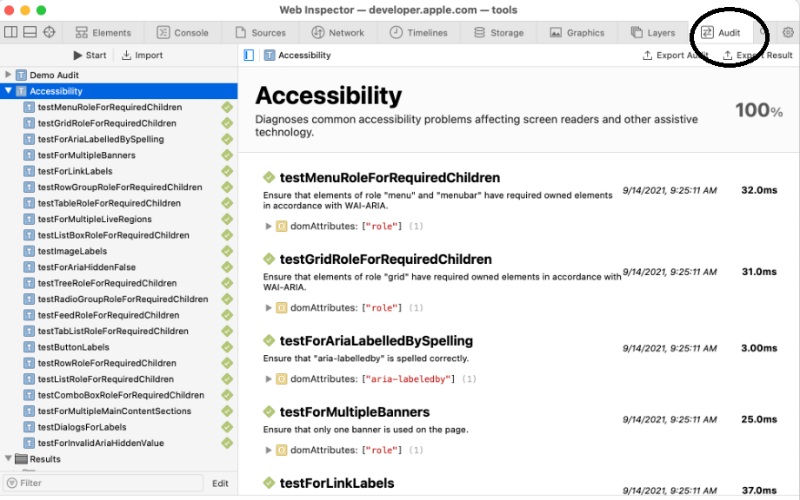
A website can become a no man's land if it doesn't focus on its quality and compliance with web standards. Thus, the audit tool in Safari's developer tools becomes a developer's trusted sidekick that runs a series of tests on the website and gives a feedback report with a structured list of issues along with the ways to optimize it.
To access this option, click on the Audit tab in the inspection menu – click run audit. Using the predefined set of rules on various categories such as 'Performance,' Accessibility, Practices, and SEO, the tool runs a comparison test. Once the audit is done, Safari provides a detailed report of the same. The amusing part is how it comes up with an explanatory report as to why this issue matters and how it could impact the performance of the website. It also provides actionable advice, such as optimizing images, removing unnecessary/ unused CSS, and so on. This improves the readability and other quality aspects of the content. In the context of debugging, the audit tool identifies other hidden problems that prevent quicker load time and better performance. In most cases, on a website, content is the king. Ignoring the on-page factors is like missing the forest for the trees.
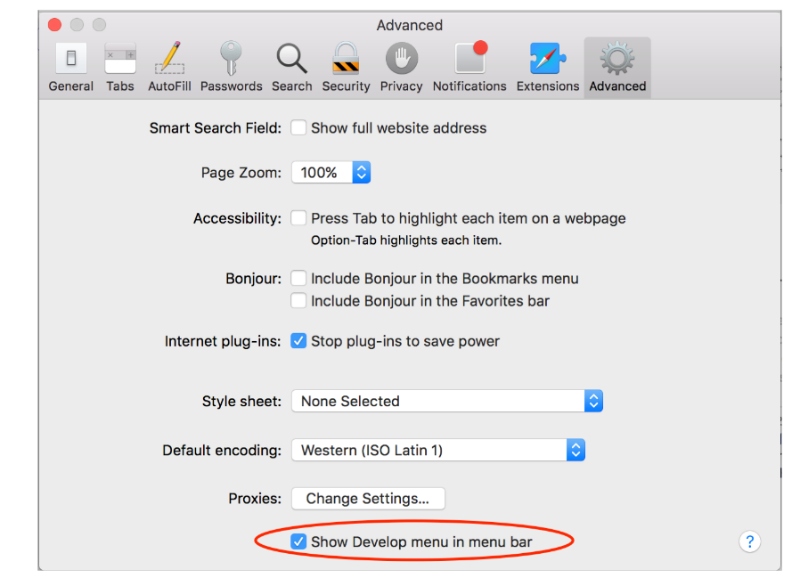
To access the Web Inspector, enable the Develop menu in Safari's preferences, then select "Show Web Inspector" from the Develop menu.
Responsive Design Mode
If we say it again, then we are probably mentioning it for the umpteenth time as to how significant it is for a website to look and feel interactive for its users. Given the fact that users are multi-device-d and certainly expect a website to perform equally, be it their smartphone, tab, or desktop, the responsive design mode is what enables it. Safari's RDM helps developers view and interact with the website in various device sizes, resolutions, and orientations. All of this is possible within the same browser window.
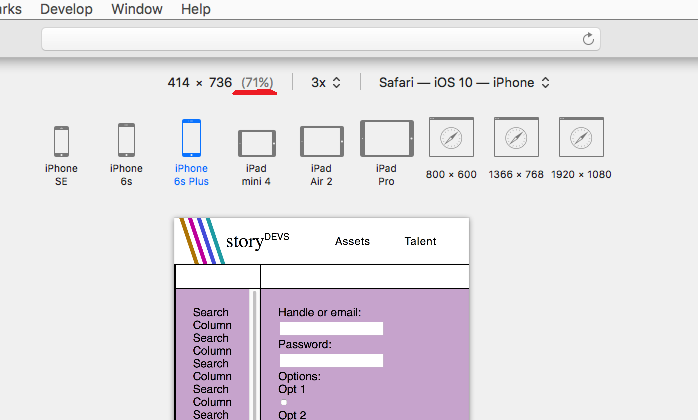
To access it, open the inspect element – click the icon with two rectangles in the toolbar at the top of the Web Inspector Window.
This enables the Responsive Design Mode, where you can select either from the preset device list or add custom dimensions. The same feature is used to adjust zoom levels and switch the orientation between portrait and landscape. The appearance of the site in dark mode can also be stimulated. Like the other features mentioned above, this feature to lends a hand in debugging the webpage. For example, the screen layout can be edited by adjusting the CSS accordingly and creating a better responsive design.
How To Enable Safari's Hidden Debug Menu & Safari's Develop Menu
Third-Party Tools and Extensions
The Web Inspector of the Safari Browser is an exponent in web development; it still provides developers with the facility to add on third-party tools and extensions to make it a well-rounded platform and provide an affable user experience.
Wappalyzer
As a cross-platform tool, Wappalyzer helps identify the tech stacks of a company by analyzing the technologies behind its website. It can detect content management systems, website frameworks, server software, and analytics tools. This software package is also available as an extension that can be installed on the Safari browser. You can also watch the video below to learn the quickest way to install Wappalyzer Extension
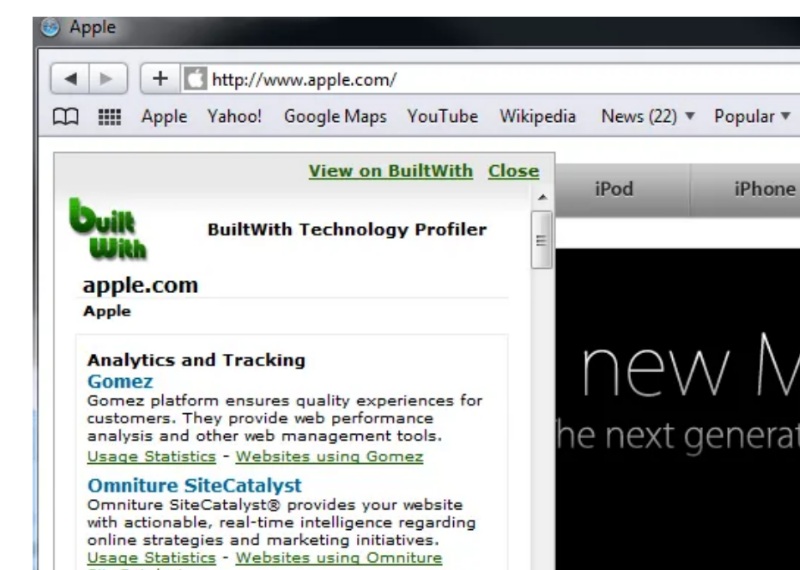
BuiltWith
BuiltWith has been in the technology profiling field for quite a while now and is considered a pioneer. A popular alternative to Wappalyzer, it offers similar functionality in detecting the technologies used behind websites. Again, Wappalyzer also provides an extension that is compatible with Safari. With just a click, the user can understand the account technology profile and other information about the site's hosting, CDN. SSL certificate and many more.
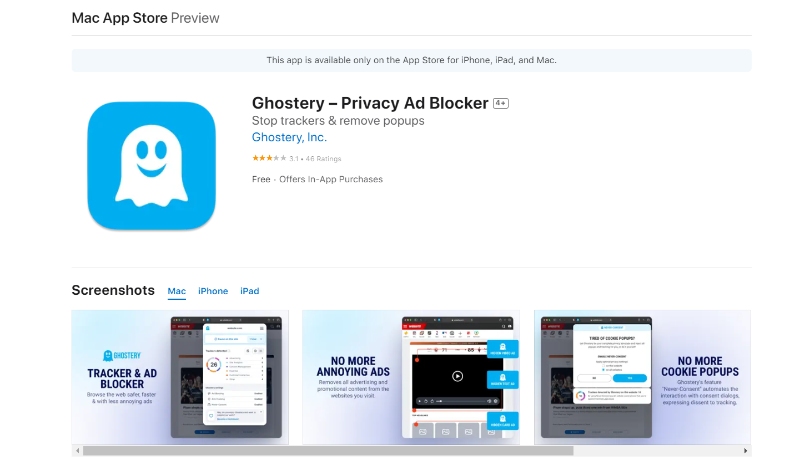
Ghostery
Users would swap anything to protect their privacy online. In that regard, Ghostery is a boon for Safari users as it is designed to block trackers and ads. This way, it improves the page performance. The main goal of this extension is to take care of the users' privacy; however, it tends to service beyond that by identifying third-party scripts and ad trackers. This helps web developers identify anomalies that hinder the performance of the website.
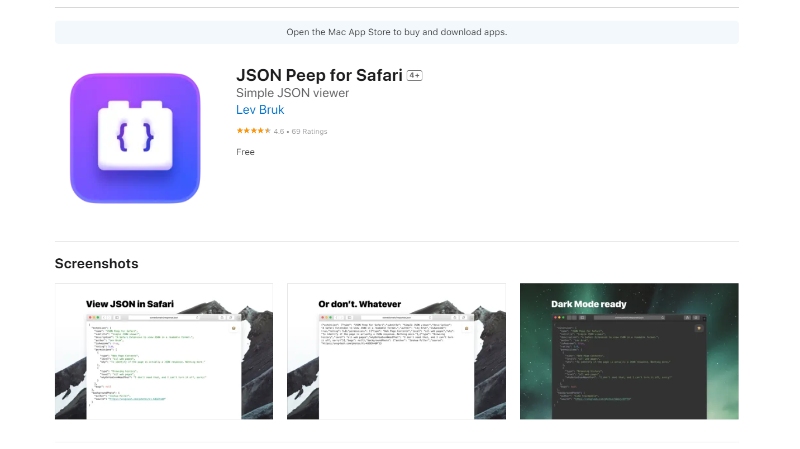
JSON Formatter
We know enough to understand the significance of JavaScript in the programming world. JSON data has become quite a common format in the modern web development era, and naturally, a JSON-formatted Extension gains significance. This extension automatically formats JSON data into a readable format, making it easier to identify errors, navigate through the data structure and understand the data.
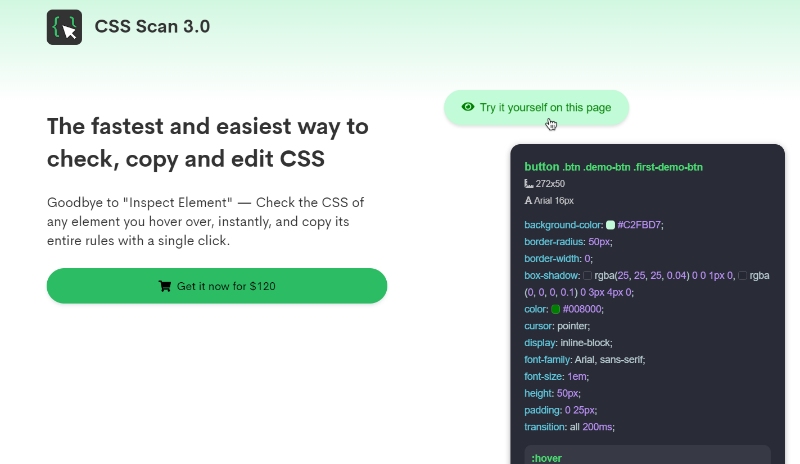
CSS Scan
Safari's built-in developer kit already offers an option to check element-specific CSS, and this extension is just an add-on. It enables you to inspect and copy CSS from any element on the webpage in just a click. This extension comes in handy when inspecting CSS is the only task in hand, and you feel like the built-in process could be a longer route to do it.
User-Agent Switcher
The thing with browsers is that they can produce inconsistent results for the same search. A web developer would certainly want to know how his work would appear in different browsers to ensure there aren't compatibility issues. Though the ideal way would be to install a couple of other browsers and check it, the easiest alternative would be to install this User-Agent Switch extension that does the job in a matter of minutes. One can easily gain the experience of multiple browsers without actually having them installed on the device. The extension allows you to change your browser's user-agent string and mimic a different device/browser/OS.
While not all third-party extensions may be compatible with Safari, exploring the Safari extensions gallery and searching for the ones that cater to your specific web development needs is essential. This is certainly not an all-inclusive list. We have managed to point out a few useful ones that will make your job as a developer a child's play.
To know more about, watch Web inspector
Built-in tools vs. Third-party extensions
A specific tool in the question and the developer's needs are the factors that determine which of the two a developer should choose. Since all tools have their advantages and limitations, it is safe to say that the choice is user-specific. However, we have managed to list a few general factors.
Functionality and features:
Safari's built-in tools, such as the Web Inspector and Responsive Design Mode, offer comprehensive web development and debugging features. They cover aspects like HTML and CSS editing, JavaScript debugging, network analysis, and responsive design testing.
However, third-party tools can provide specialized functionality that built-in tools may not offer, such as detecting web technologies, blocking trackers, or formatting JSON data.
Integration and compatibility:
The built-in tools are seamlessly integrated to work flawlessly with Safari.
Third-party tools, on the other hand, may sometimes face compatibility issues or limitations due to browser updates, API changes, or extension restrictions.
However, popular third-party tools are generally well-maintained and updated regularly to ensure compatibility with the latest browser versions.
Customization and user experience:
Safari's built-in tools have a consistent user interface and experience that aligns with the overall browser design.
Third-party tools, however, can offer more variety in terms of the user interface, customization options, and user experience. This can be an advantage for developers who prefer to tailor their development environment to their preferences.
Learning curve:
Safari's built-in tools have a consistent user interface and experience that aligns with the overall browser design.
Third-party tools, however, can offer more variety in terms of the user interface, customization options, and user experience. This can be an advantage for developers who prefer to tailor their development environment to their preferences.
While Safari's built-in tools offer a robust, well-integrated development environment, third-party tools can provide specialized functionality or customization options. It's often a good idea to experiment with various tools and extensions to find the best combination that suits your requirements.
For more web technology related posts visit our blog ful.io
Conclusion
Web development is just a piece of cake with the help of these tools and extensions. However, it is important to understand that tools are just instruments, and it is the master's expertise that counts. A good tool in the bad hands is as good as not having it. Thereby depend on your instinct and skillset. Pick the tools that feel like a right fit for your environment. Mess around and master the art of customizing your Safari browser. Streamline your web development and debugging process, optimize your websites, and ensure a better user experience across devices.